Apple Stock Financial Analysis
In this Project I analyzed Apple's stock price data using Python and the 'yfinance' package.
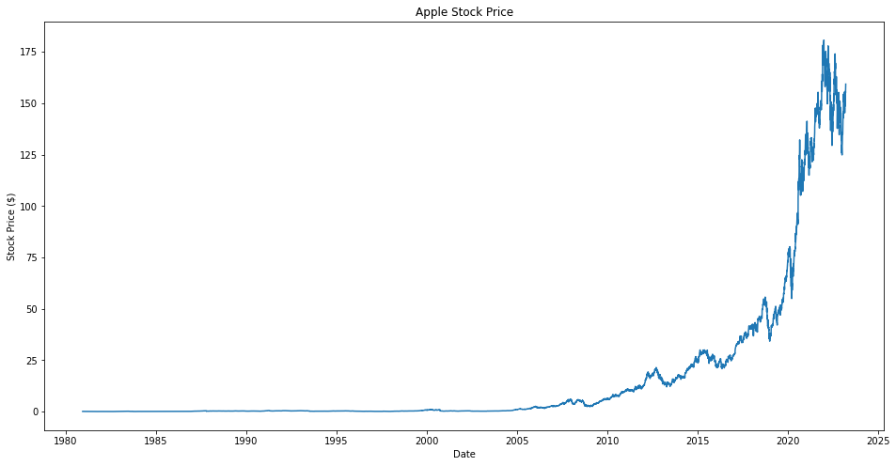
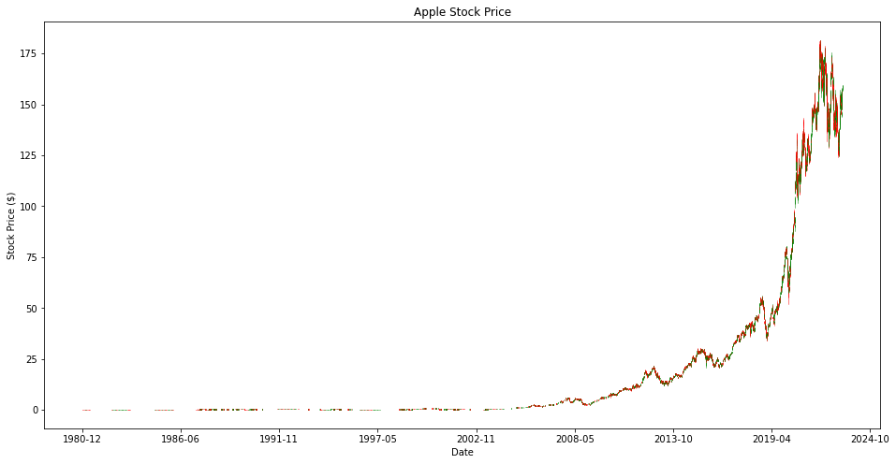
The Python code retrieves the data, cleans it,
then visualized the stock price over time using a line plot and candlestick chart
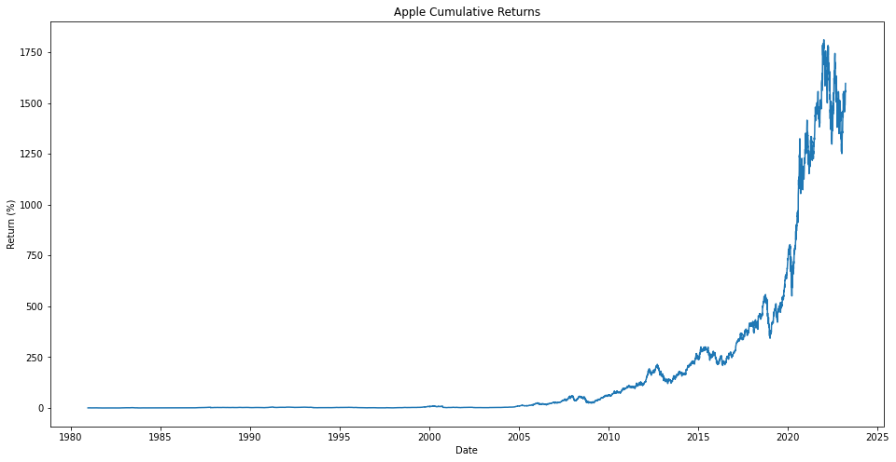
Next, we calculated the daily returns and volatility of the stock,
and plotted its cumulative returns.
We then used a histogram and density plot to visualize the distribution of daily returns,
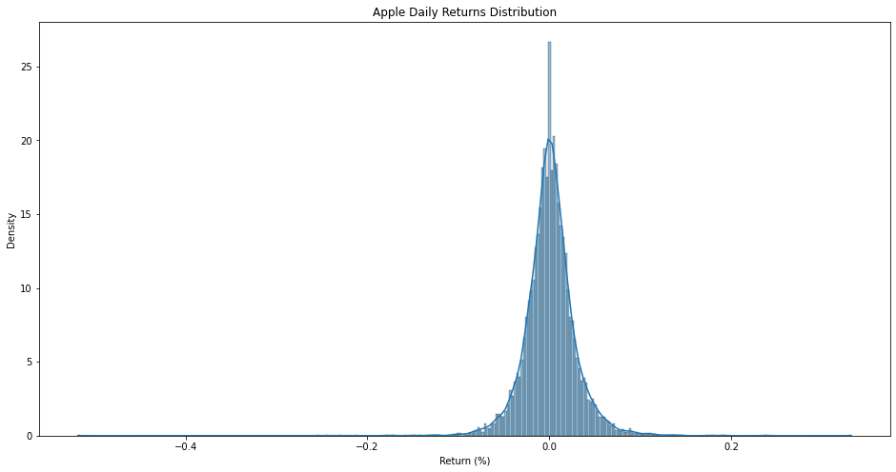
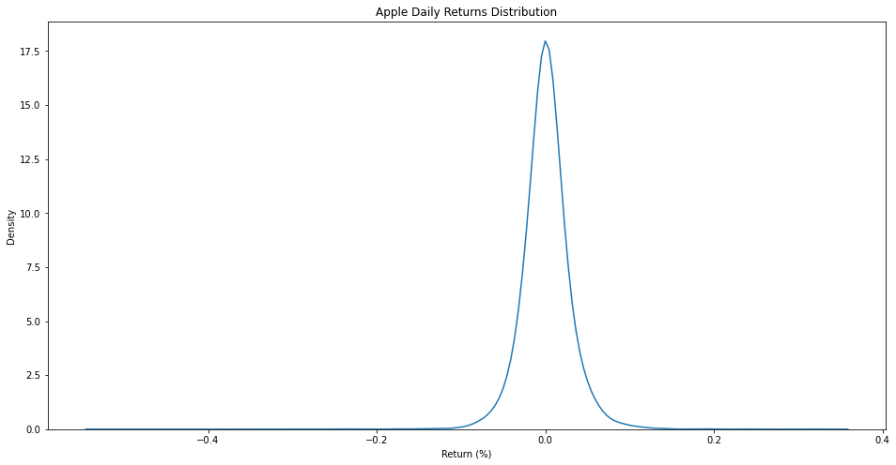
and performed a normality test to assess whether the returns follow a normal distribution.

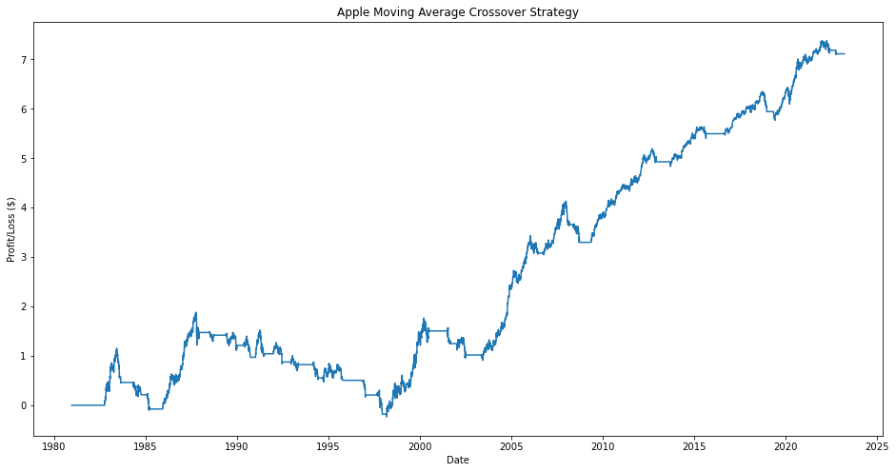
We also implemented a Moving Average Crossover strategy to generate buy/sell signals based on the stock's 50-day and 200-day moving
averages, and calculated the daily profit/loss based on these signals.
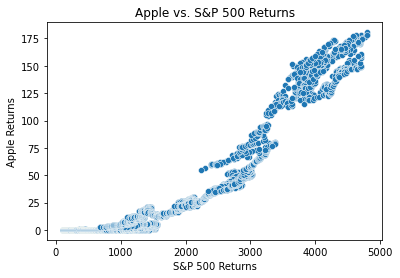
We then examined the correlation between Apple's stock returns and those of the S&P 500
using a scatter plot and correlation coefficient.
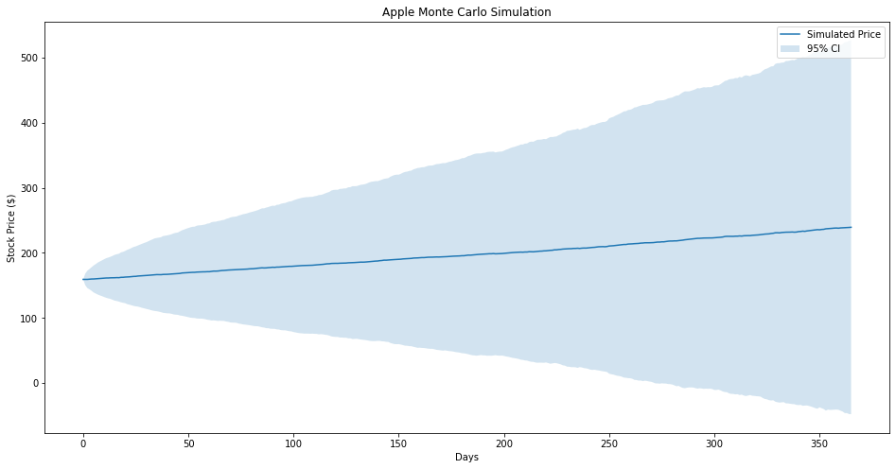
Finally, We performs a Monte Carlo simulation to predict future Apple stock prices based on historical daily returns.
Code
The Python code for this project can be found Here