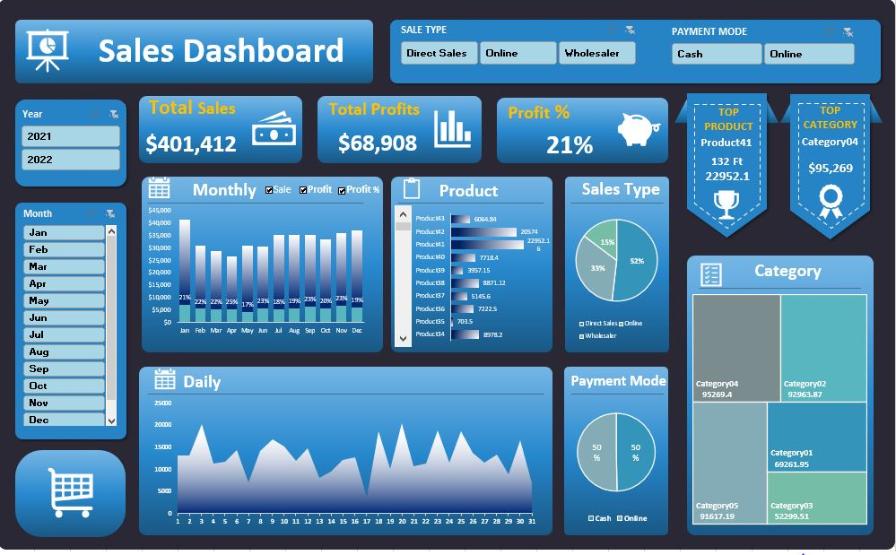
Business Sales Dashboard
My dynamic Sales Dashboard is designed to help businesses track their sales performance and make data-driven decisions.
This dashboard allows you to monitor key sales metrics, such as revenue,
units sold, and profit margin. You can analyze sales data by product,
region, or time periods to identify trends and opportunities for growth.
In this project, I first gather all the necessary sales data, such as revenue, units sold, and profit margin .
from various sources such as sales records, and inventory management systems, and input this data into the excel.
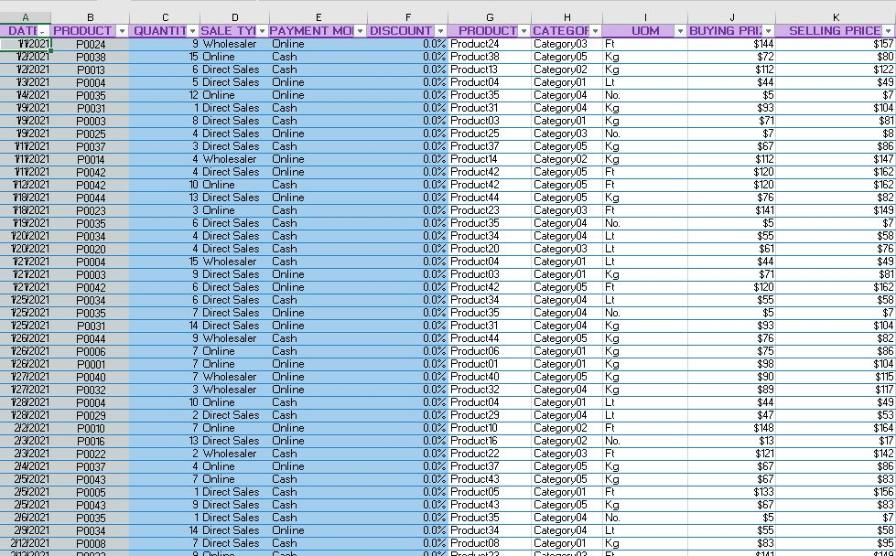
Once the data is collected, it needs to be cleaned and organized to ensure accuracy and consistency.
This involves removing duplicate entries, correcting errors, and and standardizing data formats.
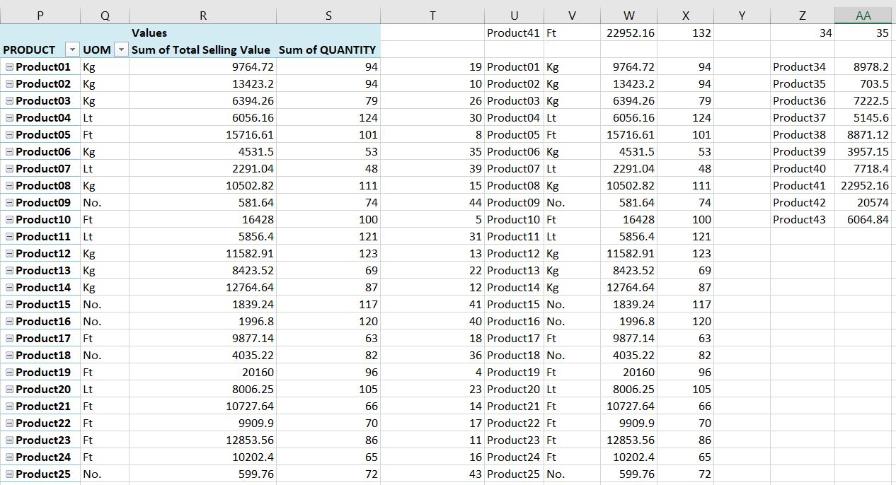
And using pivot tables to summarize and analyze the data we have and calculate the total sales revenue,
units sold, and profit margin for each product, region, or time period.
Finally, I start building the Sales dashboard.
This involves using pivot charts and slicers to create a user-friendly interface that give you
an overview of your sales performance and to highlight any areas that need attention.
Pivot charts allow you to visualize the data in various formats such as bar charts, and Pie charts,
And slicers allow you to filter the data and see specific sale type, or payment mode, or time periods.
Files
You can access this dashboard in my Github Page Here