Covid19 Data Analysis with SQL
In this project I analyzed Covid19 Dataset with SQL.
This project involved importing a dataset from Excel to SQL Server and then
cleaning and analyzing the data to identify trends and insights, and finally building a dashboard with charts & graphs to showcase the results we got.
Cleaning & Processing
To begin, I start analyzing and exploring the data by performing these analysis:
- Show the likelihood of dying of you contract Covid
-Shows what percentage of population got Covid
-Looking at countries with the highest infection rate compared to population
-Showing countries with the highest death percentage
-Showing countries with the highest death count
-Looking at total population vs vaccinations
-Creating view to store data for later visualizations
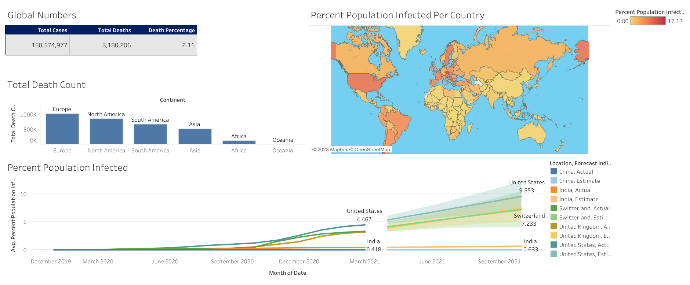
Visualizations
Once the data is cleaned and organized, I used SQL queries and functions to analyze the data and identify patterns and trends. I then presented the results with Tableau through charts and graphs, which allowed us to communicate my findings in an engaging and easy-to-understand format.
Code
All the files used for this project can be found Here