Ecommerce-data Analysis Project
This data analysis project explores an eCommerce dataset from Kaggle,
which contains information about the online purchases made by customers.
The project was conducted using Microsoft SQL Server to extract and
analyze the data, and Power BI was used to create insightful and
interactive visualizations to convey the findings.
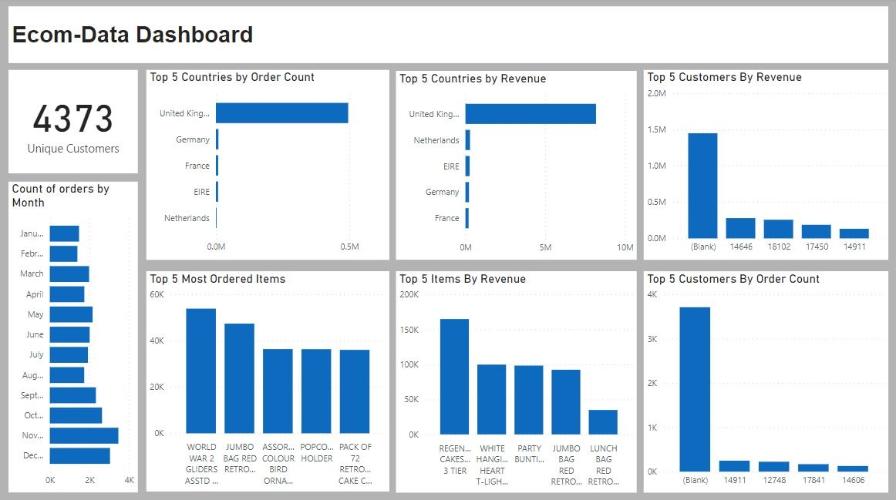
The project starts by exploring the basic features of the dataset, such as the number of records, the number of customers, and the number of orders. It then delves into the sales data, including the most popular products and categories, the most profitable products, and the top-selling countries.
The project also analyzes the customer behavior and buying patterns,
such as the frequency of purchases, the average order value, and the
customer retention rate.
Visualizations
The visualizations created using Power BI provide an interactive way to explore the data and gain insights. They include various charts and graphs, such as bar charts, and card chart, to showcase the findings in a visually appealing way.
Code
All the files used for this project can be found Here