IT Company Spend Dashboard
The project aims to provide an overview of the company's spending across different sectors, time, and regions where it operates.
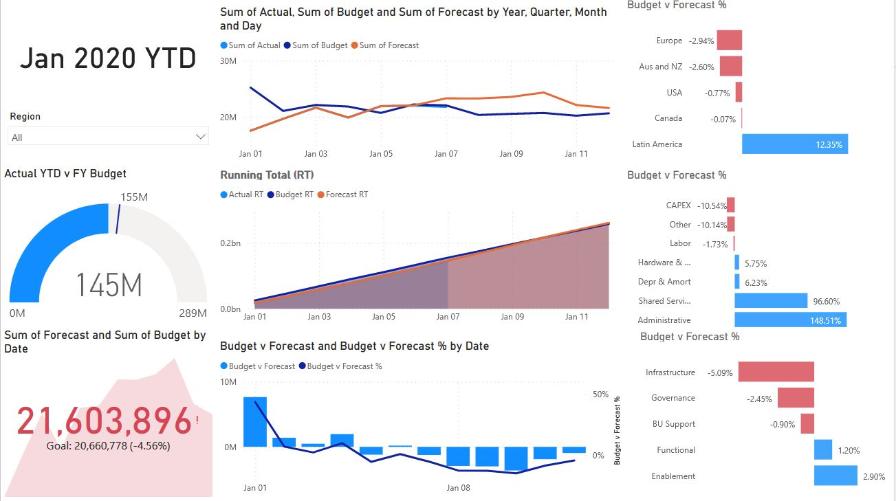
The dashboard includes data on budget versus forecast versus actual spending for each sector, allowing users to monitor spending trends and adjust budgets accordingly.
The IT Company Spend Dashboard is designed to help managers and
executives make data-driven decisions by providing insights into the
company's spending patterns.
Visualizations
Users can filter data by time, region, and sector, allowing them to focus on specific areas of interest. The dashboard provides a range of visualizations, including charts and graphs, to help users quickly understand spending trends and identify potential areas for improvement.
Code
All the files used for this project can be found Here