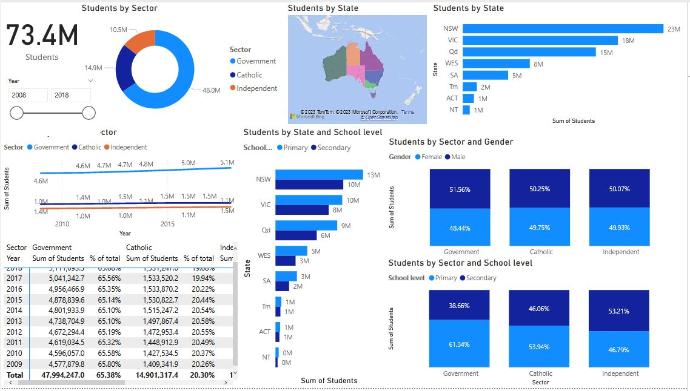
Schools Analysis Dashboard
This project aims to provide a comprehensive analysis of schools in different states, focusing on student and staff data.
Schools Analysis Dashboard
This project aims to provide a comprehensive analysis of schools in different states, focusing on student and staff data.


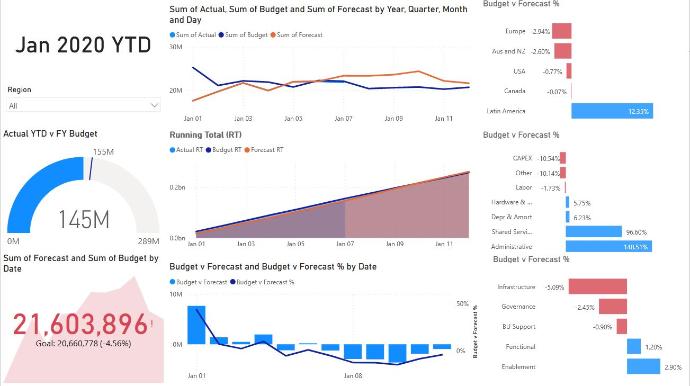
It Company Spend Dashboard
The project aims to provide an overview of the company's spending across different sectors, time, and regions where it operates.
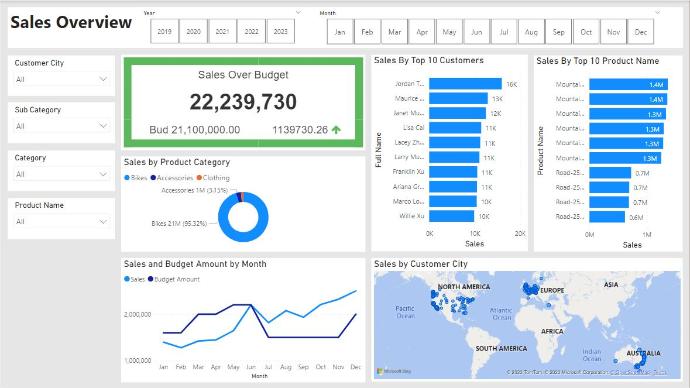
Executive Sales Dashboard
In this project, I created an
executive sales report for sales managers,
So that they can track which customers buy the most and which products sell the most, and track sales over time against budget.
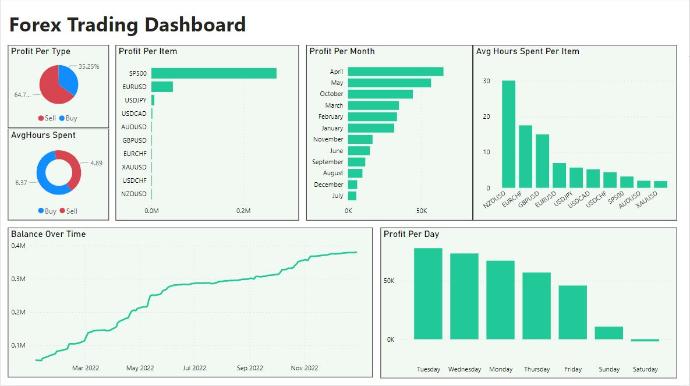
Trading Results Dashboard
My dynamic dashboard is designed
to track and analyze your trading results to make informed decisions and improve your profitability.
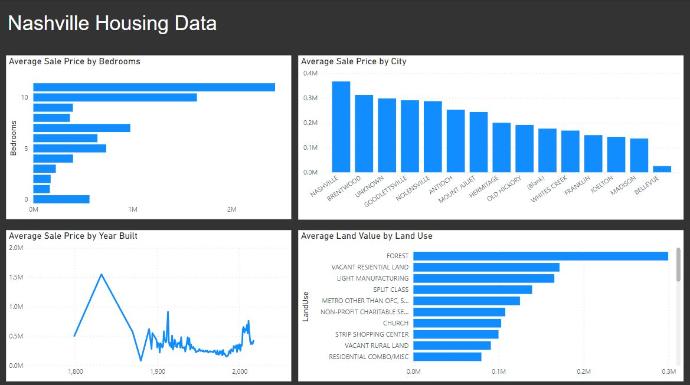
Housing Analysis Dashboard
This project involve importing a housing dataset from Excel to SQL Server and then cleaning and analyzing the data to identify trends and insights, and finally building a dashboard with charts & graphs in PowerBi to showcase the results we got.
It Company Spend Dashboard
The project aims to provide an overview of the company's spending across different sectors, time, and regions where it operates.
Executive Sales Report
In this project, We created an
executive sales report for sales managers,
So that they can track which customers buy the most and which products sell the most, and track sales over time against budget.

Trading Results Dashboard
Our dynamic dashboard is designed
to track and analyze your trading results to make informed decisions and improve your profitability.

Housing Dataset Analysis
This project involved importing a housing dataset from Excel to SQL Server and then
cleaning and analyzing the data to identify trends and insights, and finally building a dashboard with charts & graphs in PowerBi to showcase the results we got.
